How To Use Data to Grow Your Business
- Home
- Articles
- Business Benchmarks
- How To Use Data to Grow Your Business

Whether it’s making decision-making simpler, reducing costs, boosting employee performance, understanding your customers better, or refining your marketing efforts, data can hold the key.
These days, there is simply so much data that can be analysed, it can be hard to know where to start.
To help, we’ve put together a few ways that data can help small to medium business owners. You can jump through to the topic of your choice below – or just read through to find out how data can help you grow your business.
The article covers:
Why Your Business Should Analyse Data
1. Data Makes Decisions Easier
One of the key benefits of data for any business owner is: easier decisions. Data not only supports decision-making but also makes the process more straightforward and less reliant on guesswork. Here’s how different types of data can inform key business aspects:
➤ Financial Data: Reviewing financial statements, sales reports, and expense records can highlight trends and patterns essential for financial planning and performance evaluation.
➤ Benchmarking Data: Comparing your business performance against industry standards or competitors offers a clear perspective on where you stand and where improvement is needed.
Application: Use financial and benchmarking data to perform a SWOT analysis (Strengths, Weaknesses, Opportunities, Threats) of your business. This analysis, alongside strategic planning efforts, can guide the direction of your business, highlighting areas for growth and improvement.
2. Use Data Analysis To Reduce Costs
Identifying ways to cut costs without compromising on quality or productivity is a continuous challenge for any business. Data can show you where to focus:
➤ Financial Data: Analyse your expenditure to pinpoint areas where costs can be reduced, such as unnecessary subscriptions, inefficient vendors, or wasteful spending patterns. Using accounting software such as Xero, MYOB or QuickBooks can help you see how monthly costs accumulate over the year; helping to identify savings.
➤Benchmarking Data: Understanding industry benchmarks for operational costs can help you identify whether you’re spending more than the norm in specific areas and adjust accordingly. This can support your business to renegotiate with suppliers if needed, or seek cheaper alternatives.
Strategy Implementation: You can leverage this data to cut unnecessary costs, negotiate better terms with suppliers, or eliminate redundant processes.
3. Improve Employee Performance With Data
Enhancing your team’s performance can lead to significant improvements in productivity and, ultimately, profitability. Here’s the type of data that can help:
➤ Financial Data: Use financial metrics to set performance benchmarks and goals for teams and individuals.
➤Benchmarking Data: See how your team’s productivity compares to industry standards or competitors. From here, you can analyse if your team is performing at an optimum level.
➤Apps and Tools: Modern tools such as HubStaff can provide analytics on employee activity and productivity. These tools offer insights into areas for improvement and training.
Application: with this data, you can identify training needs, adjust workflows, set realistic performance goals, and recognise and reward high achievers.
4. Gain Better Understanding Of Your Customers & Markets
In-depth knowledge of your customers and the broader market landscape can inform product development, marketing strategies, and customer service enhancements. Below is a list of data sources that many businesses will have on hand:
➤CRM (Customer Relationship Management) Systems: Analyse customer interactions, sales pipelines, and feedback.
➤Point of Sale Systems: Track sales data to understand purchasing trends and preferences.
➤Customer Surveys: Collect direct feedback from your customers to understand their needs and satisfaction levels.
In addition to internal data, business owners can seek external data to find out more about the industry and market. This includes:
➤Competitor Analysis: Identify what competitors are doing well and where there might be gaps in the market. (Find out how to write a competitor analysis here.)
➤ABS (Australian Bureau of Statistics): Utilise broader demographic and economic data to understand market trends and shifts.
➤Benchmarking Data: You can leverage our Benchmark Reports to find industry insights and trends. See our Industry Analysis reports here: Australian Industry Reports
Strategy Implementation: Using this data, you can tailor your products or services, enhance customer experiences, and identify new market opportunities.
5. Analyse (& Justify!) Your Marketing Efforts
To ensure that your marketing dollars are being spent effectively, it’s essential to analyse the results of your marketing activities continually. Some of the most common methods of analysing your marketing performance include:
➤Google Analytics: Track website traffic, user behaviour, and conversion rates.
➤Website Hits and Rankings: Monitor how your site performs in search engine rankings and how users interact with your content.
➤Sales Results: Correlate marketing campaigns with sales performance to identify what’s driving results.
➤Social Media Analytics: Use social media platforms’ analytics to gauge engagement levels and the success of social media campaigns.
Application: This data allows you to refine your marketing strategies, focusing on the channels and content that deliver the best ROI. Adjust your approach based on what the data tells you about your audience’s preferences and behaviours.
How To Ensure Data Creates Value For Your Business
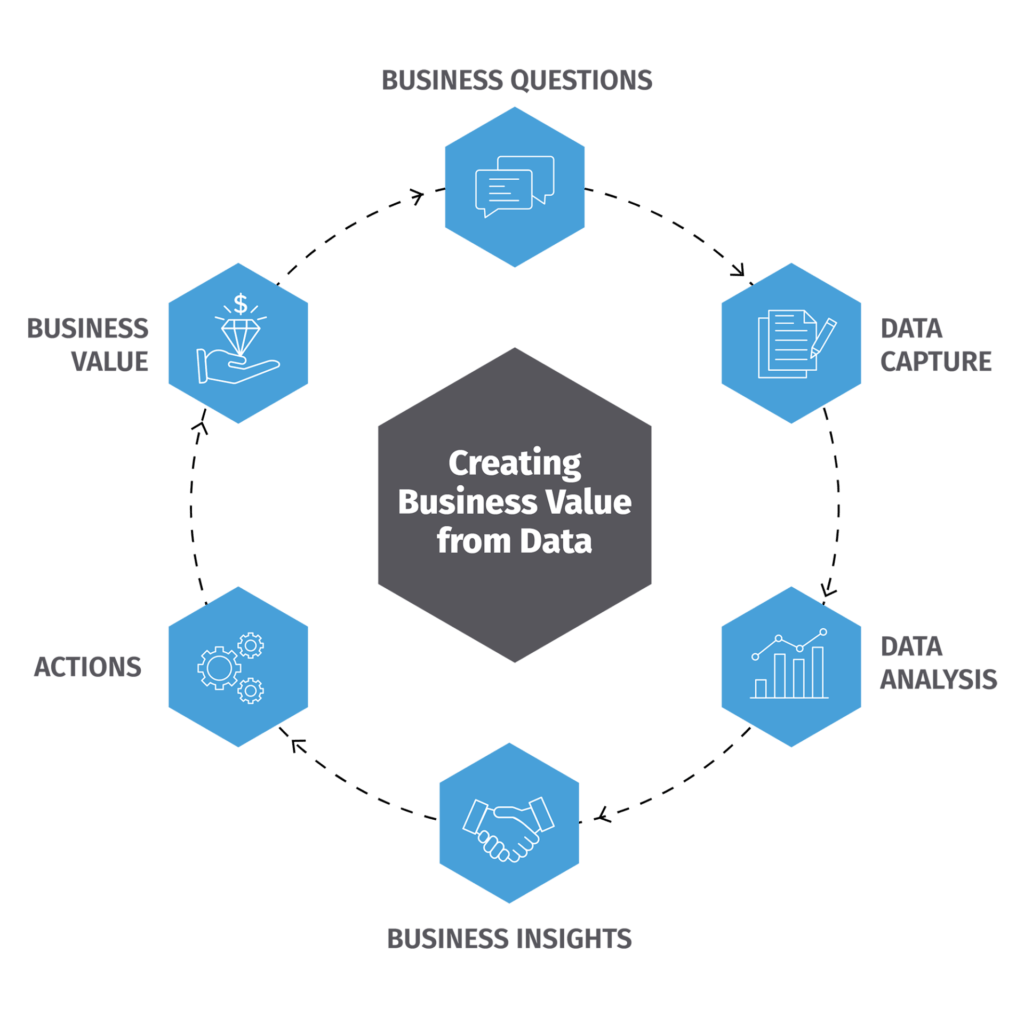
Understanding why you should analyse data is just part of the equation. It is also important to ensure your business has a process to take you from data collection, through to adding value for the business. We have created a short cycle to show how you can grow your business with data analysis.

1. Business Questions
Ideally, data analysis should begin with a clear understanding of what you want to analyse. This may be a specific question such as: how well has product ‘x’ sold in the past 6 months? Or, something more broad such as: how well is my business performing compared to my competitors?
Being clear on what you want to know will help with the remaining steps of the process.
2. Data Capture
This stage involves collecting data systematically; in other words, making sure you know where the data is coming from, how you are storing it and how you are checking it. This may be as simple as collecting via a POS system and tracking it in your financial application (e.g. Xero). Or, it may be more complex and being collected and stored in multiple sources. No matter the method, you should ensure that all data being collected is going through a quality check. For smaller data sets, this is often a manual task and referred to as ‘data cleaning.’ For larger data sets, you may want to set up ‘rules’ that exclude data of poor quality.
3. Data Analysis
The analysis stage looks at what is happening. This is where you can refer back to your question (in step 1) and attempt to provide an answer. Often, when analysing data, you will find more information than you really need! That is why it is important to have a focus in this stage. You may use one data set for multiple analysis.
Occasionally, when businesses undertake a project, they end at Data Analysis. They provide a picture of what has happened.
However, it is important to continue onto Business Insights to ensure the business truly leverages the data.
4. Business Insights
Here, we look at the analysed data and ask: why has this happened?
It is understanding how the data is translated into knowledge about the business’s performance, customer behaviour, market trends, and operational efficiency. These insights can then be used to guide strategic decisions, providing clarity and direction for the company’s next moves. They can also be used to help predict customer needs, optimise operations, and identify new market opportunities.
5. Actions
With insights identified, businesses can proceed to the Actions stage. This is where strategies and initiatives are created to leverage the analysis. Actions can range from introducing new products, tweaking marketing strategies, to restructuring operations. This phase is about tangible change—implementing steps that will materialise the value hidden within the data.
6. Business Value
The outcome of the cycle is adding Business Value. Actions informed by insights lead to measurable outcomes: increased revenue, reduced costs, improved customer satisfaction, or enhanced product quality. This phase validates the entire cycle, showcasing the real-world benefits and competitive advantage gained through effective data utilisation.
